


Featured

9/11 Tribute to Heroes Memorial Ceremony
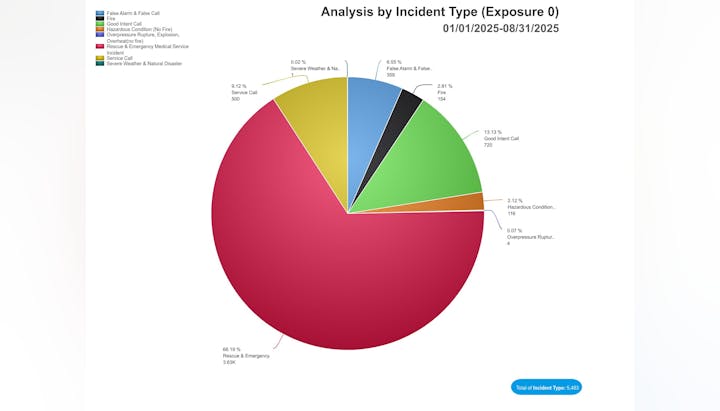
2025 January through August Incidents
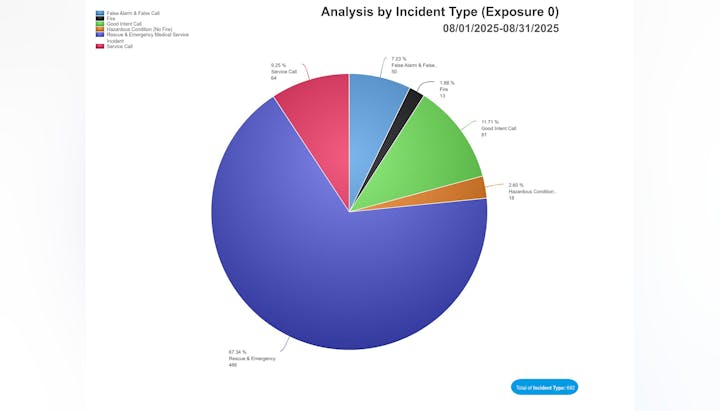
August 2025 Incidents

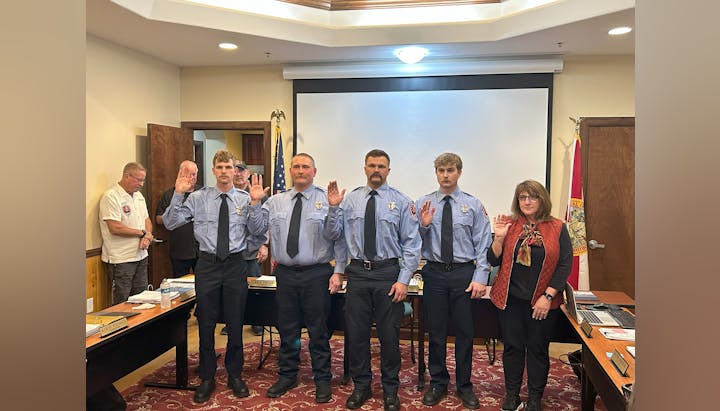
Promotion Ceremony

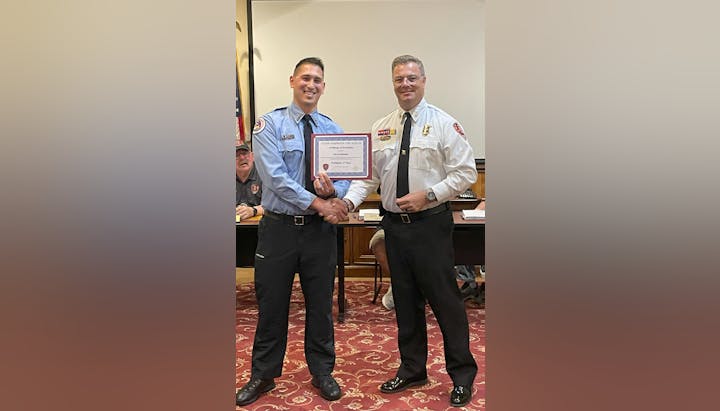
New Firefighters!!!

Chief, Dr. Kyle Bradshaw's Retirement Ceremony

Incident Type July 2025

July 2025 Awards
Welcome CHFR's newest Fire Commissioner and New Hires

2024 Awards
Promotions and 10 Years of Service

Hard Work and Dedication

Milestones and Promotions
90% Response Time by Station Sept 2024
Incidents by Station Sept 2024
Incidents By Unit Sept 2024
Incidents by Month Oct 2023 – Sept 2024

Calendar

Covid19